Reporting
|
Reporting
|
Gold-Vision harnesses the power or the Microsoft SQL Server® database by integrating the free SQL Reporting Services solution.
Either choose from the wealth of pre-installed reports, or generate your own reports simply from any list view in Gold-Vision.
Output the results into any of the popular formats (Excel, Word, PDF, XML, HTML, CSV etc.) for additional use or analysis.
Depending on your installation, reports can be scheduled for automatic distribution. To have this set up or to discuss the options, contact your Account Manager.
Gold-Vision contains a large number of Standard Reports that allow you to report on Accounts, Activities and Projects plus on your Sales Forecasts and History.
You can also create your own User Defined Reports to run as and when you need them.
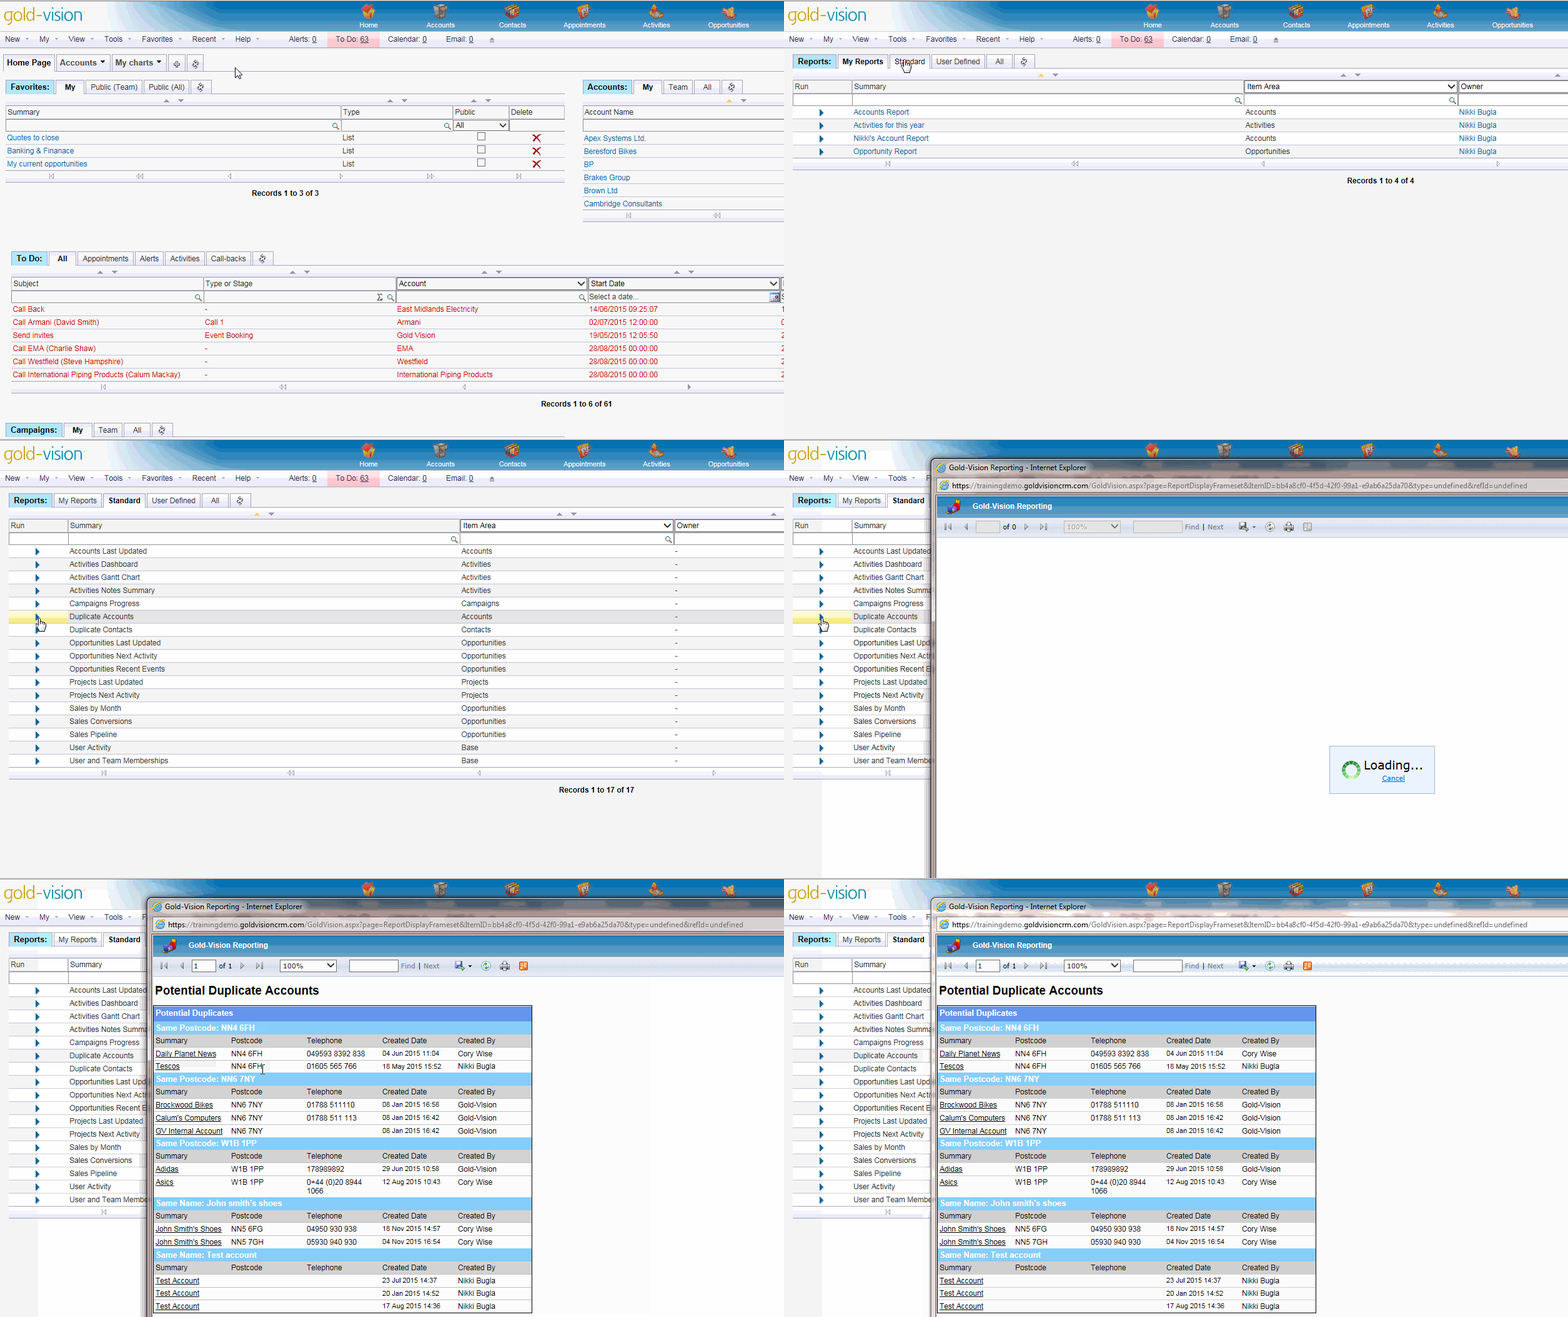
A selection on Standard Reports are available in Gold-Vision - for example Duplicate Accounts/Contacts Report or the Sales Conversion Report, . To run one of these reports go to the Tools Menu select Reporting, then click on the Standard Tab. Click the Run arrow to run the selected report.
![]()
From a Standard Report you can:
Click on any item which is underlined to open up the associated Gold-Vision record, including Accounts, Quotes, Activities
If applicable the selectable options can be amended and the report updated by re-clicking View Report.
Export – Select a format – see below for further information.
Refresh – if changes to the selectable options have been made, click Refresh to update to information.
Print.
Data can be exported in a variety of formats
Click on Select a Format
Select from:
XML file – used for Data Interchange
CSV – Comma separated format
MHTML - (web archive)
Tiff file – Export the chart or report as an image
Word – data exported to word and can be edited as required
User Defined Reports can be generated from any List in Gold-Vision. Filter with the options that you would like to include in your Report, more columns can be added later and the report can be ordered and sorted and filtered further to meet your requirements.
Create the list you want to take the Report from.
Select the options you want using the dropdown options and filter fields.
Click the Report tab and select Create a Report
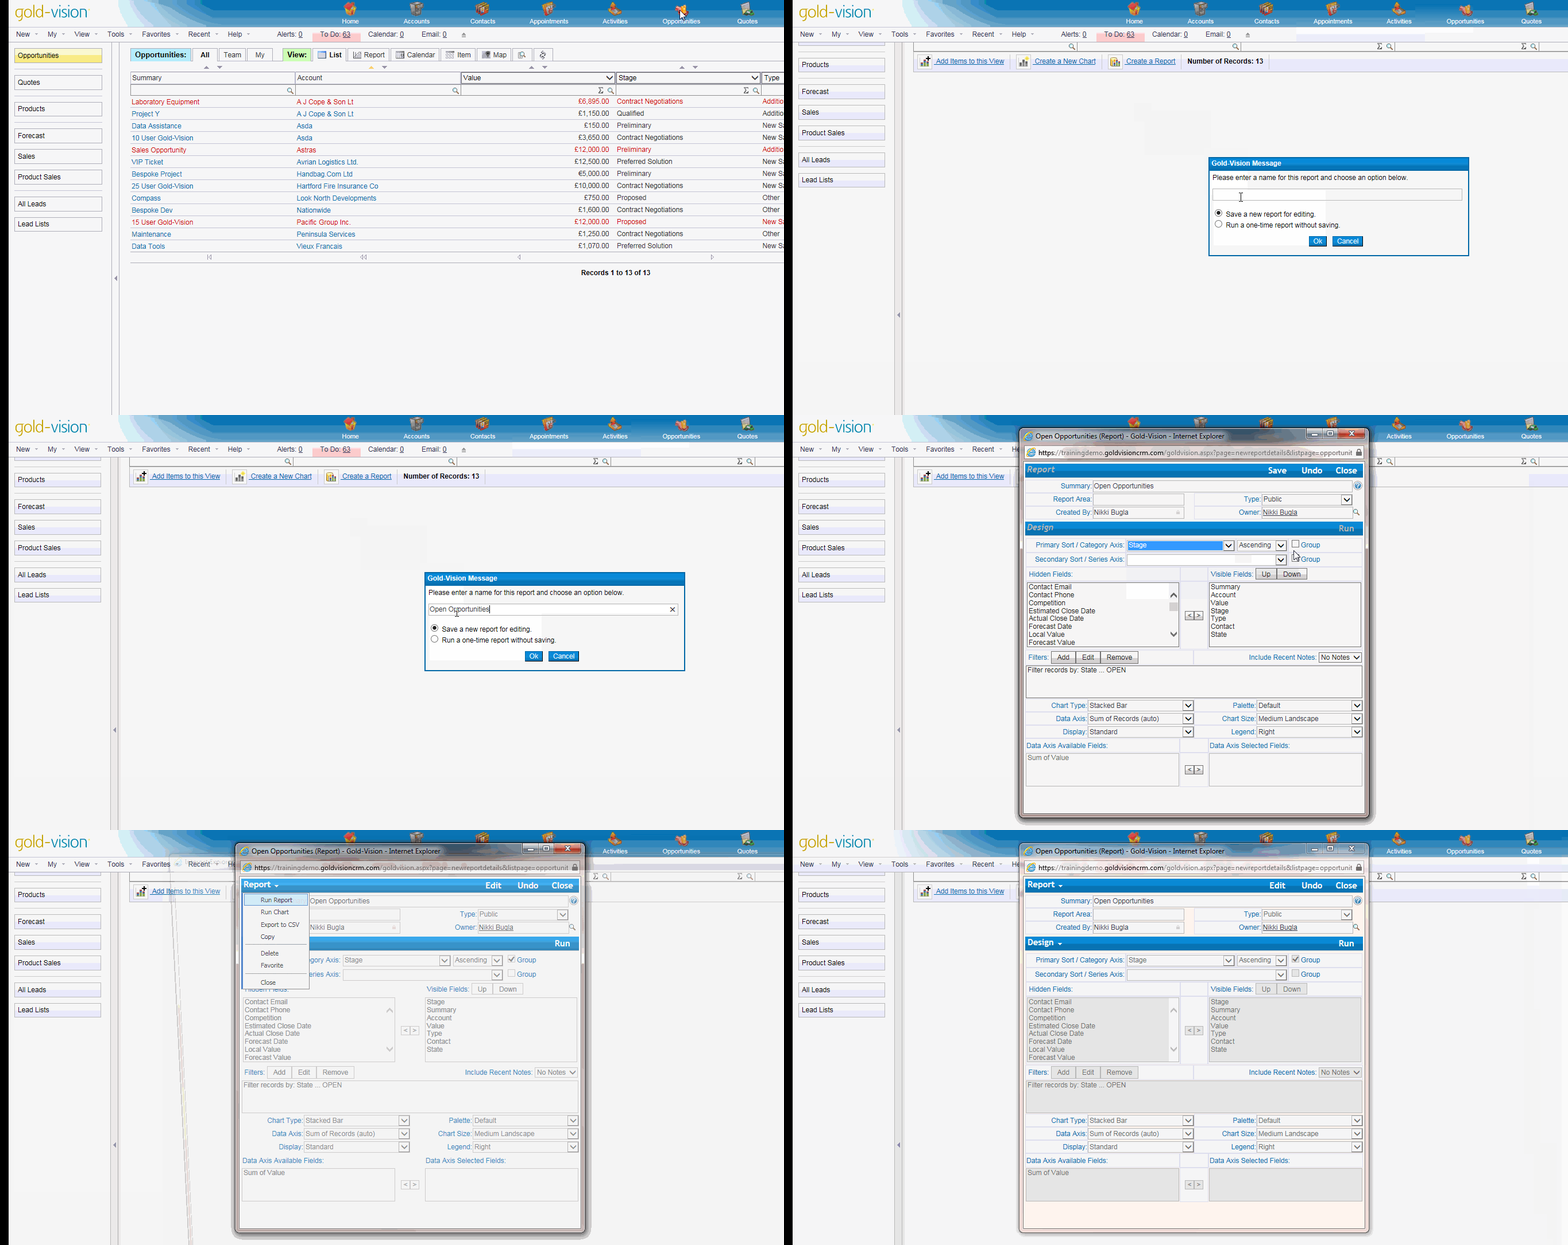
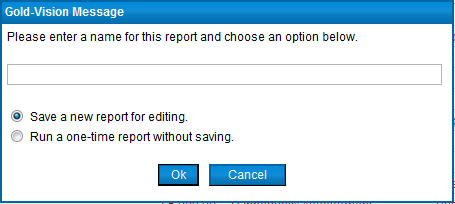
Select either
Run a one-time report without saving, click OK.
Report will open on a new window, but is not editable.
OR
Enter a name and Save a new report for editing, click OK.
The Custom Report window will open:
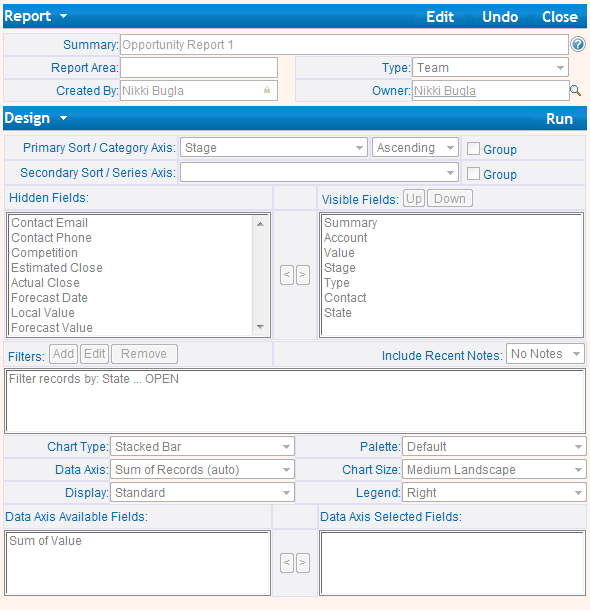
To run the Report without Editing, either click Report, Run Report, or Click Run

Click Edit to configure the report.
Edit the header as required.
Sorting the Data
The data in the report can be sorted by the fields in the report and in either Ascending or Descending order.
For example to sort Alphabetically by Account:
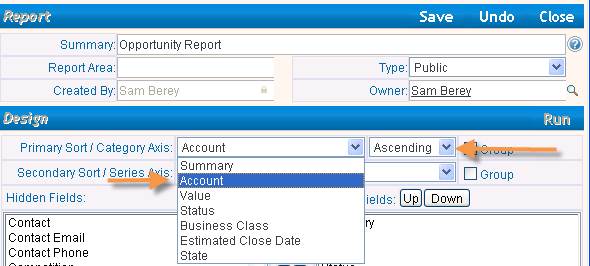
To further sort the report, select from the Secondary Sort dropdown
Group
Tick the check box to group data. For example to group Opportunities by Account

When the report is Run, click on the + to expand the list

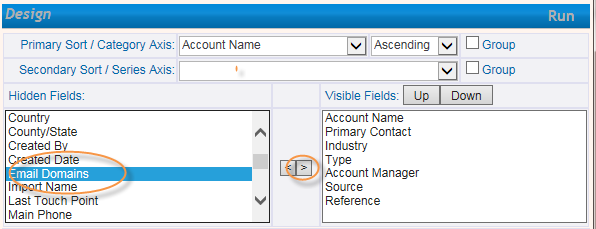
Fields:
Visible Fields - the fields selected on the original list will be visible in the report
Hidden Fields - shows a list of the fields which when selected and added can be on the report.
To Add additional fields, click on the required field in the Hidden Fields list and click the > icon to add.

To Remove fields from the Visible Fields click on the field and click the < arrow.
Moving Fields To alter the position of the field/column in the report – click on the field and select Up or Down
Date Fields
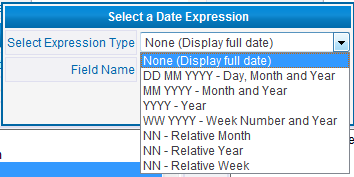
When adding a date field you will be prompted to select how you wish to express the date. Chose from the dropdown.
Notes
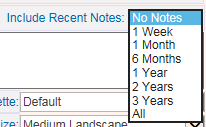
Notes can be added to the report, select from the dropdown
Filters
Filters can be Added, Edited or Removed
This original Opportunity list was filtered by Business Class and the State of the Opportunity.

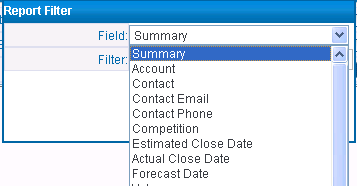
To Add a Filter, click Add and select the Field from the dropdown.
For example to Filter an Opportunity report to show only Opportunities with a probability of more than 50%: Select Probability from the Dropdown
Enter >50 in the filter field. Click OK
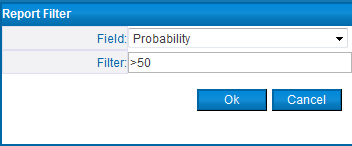
To Edit a Filter for example to change to greater than 80% probability, select the Filter, click Edit and amend the filter.

Click OK
To Remove a Filter select the Filter and click Remove. Click Yes.

Save and Run the Report.
See the Web Clip.
Using the Chart editing section a variety of charts can be produced.


Click Report, Run Chart

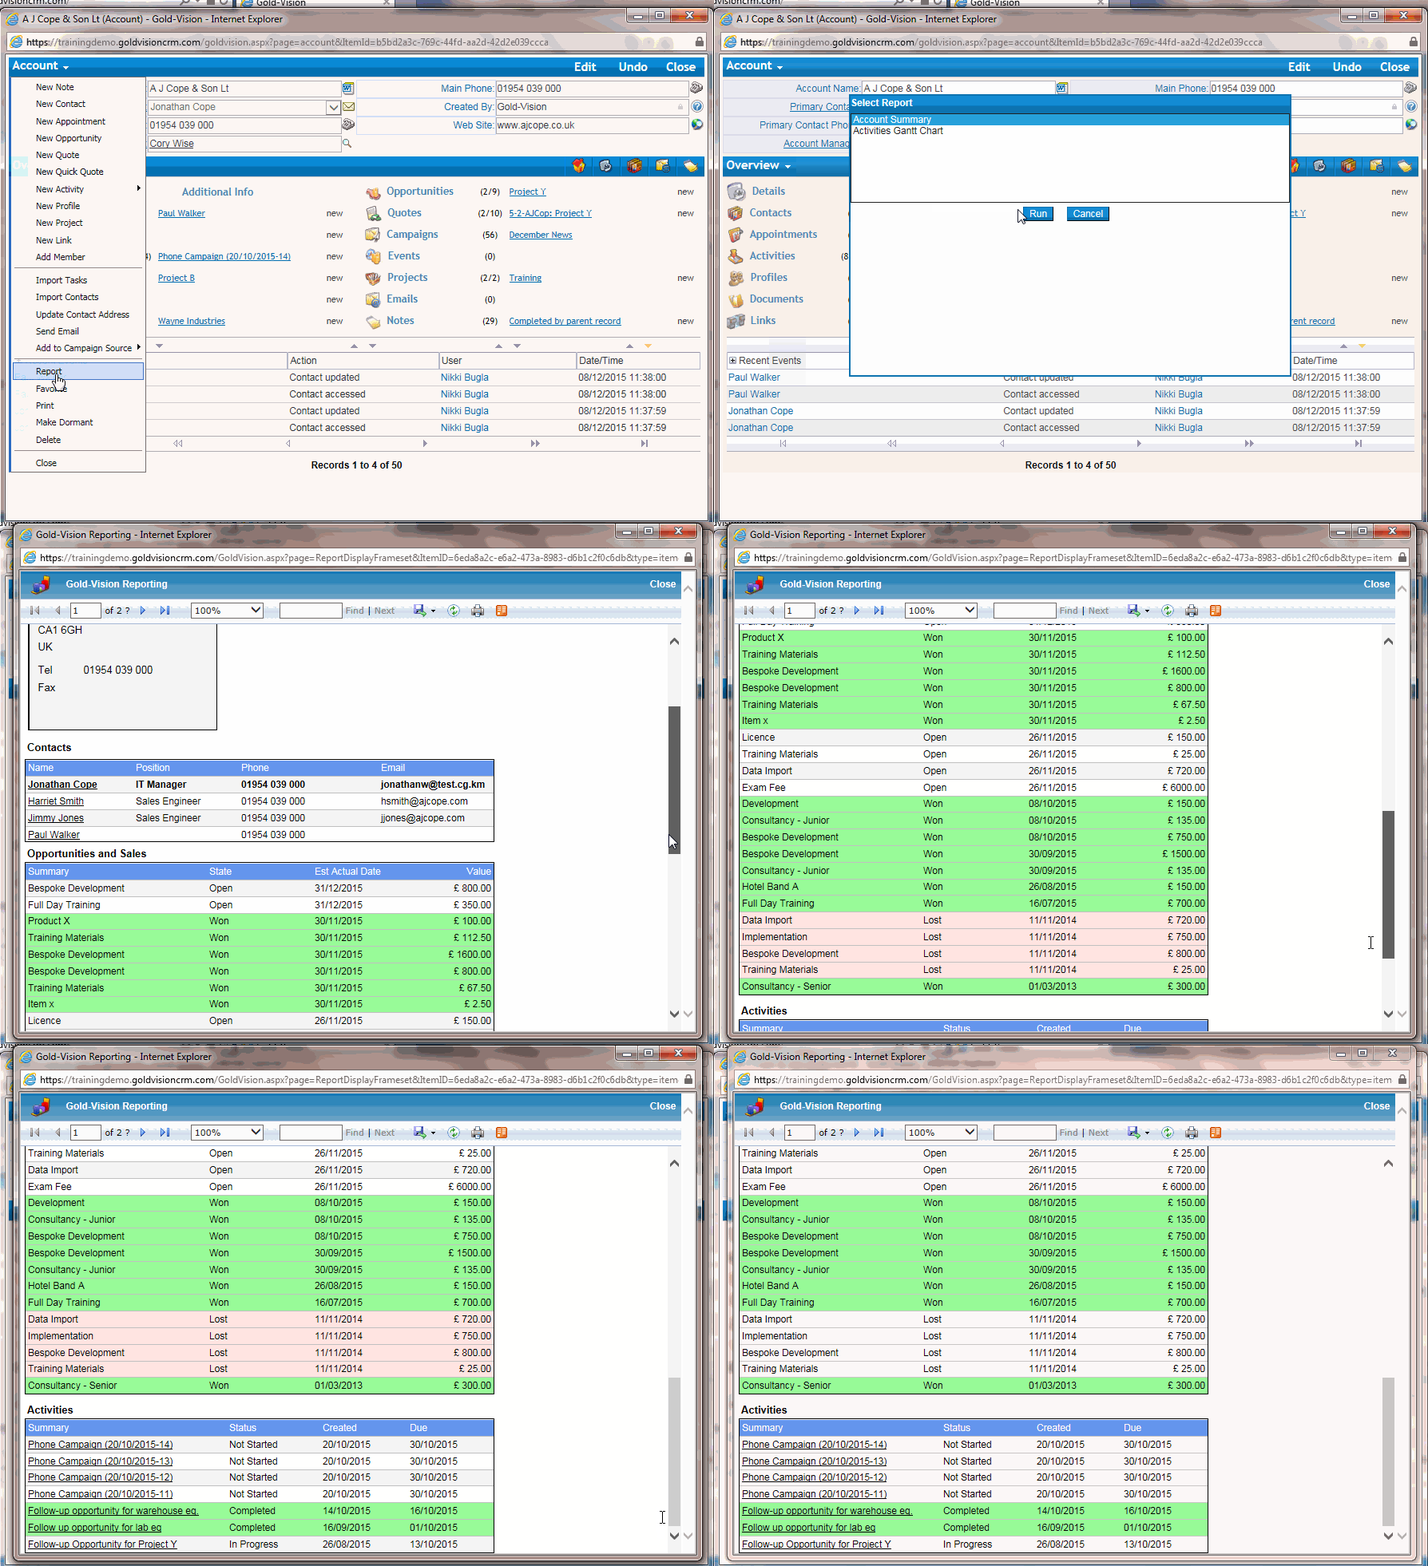
In-item reports can be run against most items in Gold-Vision. For example in an Account Record you can run an Account Summary report which shows Address and Contact details, Opportunities, Activities, Recent Events and Notes. A useful report for a sales person to print off before a sales meeting
| Account | Account Summary, Activities Gantt Chart |
| Contact | Activities Gantt Chart |
| Appointments | Appointment Summary |
| Activities | N/A |
| Opportunities | Activities Gantt Chart, Opportunity Overview |
| Quotes | N/A |
| Profiles | N/A |
| Projects | Activities Gantt Chart, Project Overview |
| Campaigns | N/A |
| Events | Events Overview, Sessions Booking Planner |
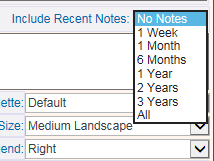
Can I include Notes in a Report?
How do I add extra columns to my Report?
From the Report record menu, select Export to CSV
Yes, you can select the time period for which you wish to include Notes:
From the Report record you can edit the columns by selecting fields in the Hidden Fields list. Use the Up/Down option to change the layout of the report.
The 'My Reports' list shows your Reports and can include Standard Reports as well as Reports created by other users

Copy a Report created by a colleague and then edit to meet your requirements


If you have a Report which you need to run regularly, make it a Favorite for easy access.

Remember to select 'This Year' from the date picker if you want to create a report you can run every year.
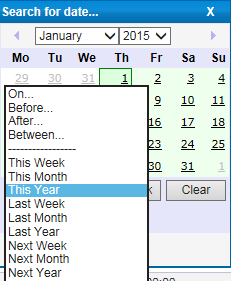
If you want a fixed time period - select between and add the from and to date
