Dashboards
|
Dashboard Tips
|
How to set up your year end dashbordsCreate year end or year on year comparison charts.
|
Reporting
|


Dashboards
|
Dashboard Tips
|
How to set up your year end dashbordsCreate year end or year on year comparison charts.
|
Reporting
|
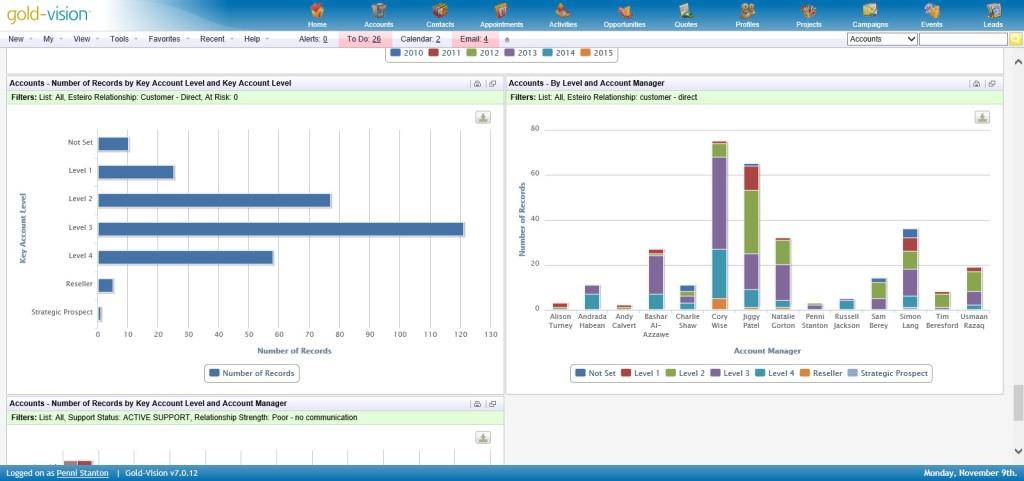
Gold-Vision has a selection of standard dashboards for easy adoption, but also allows users to quickly and easily generate their own charts for incorporation into business function dashboards.
You can setup Reporting areas as tabs from your homepage and you can share them with other Gold-Vision users.
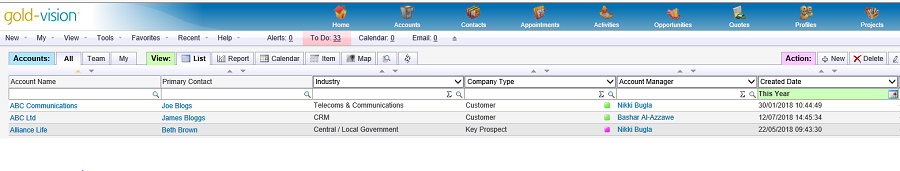
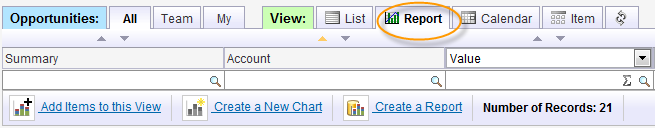
1. From any list in Gold-Vision, filter your data
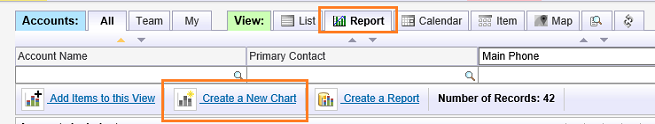
2. Click the report tab
3. Select create a new chart
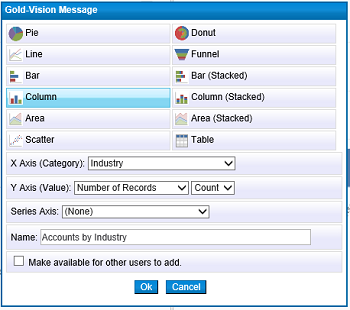
4. Apply your chart requirements
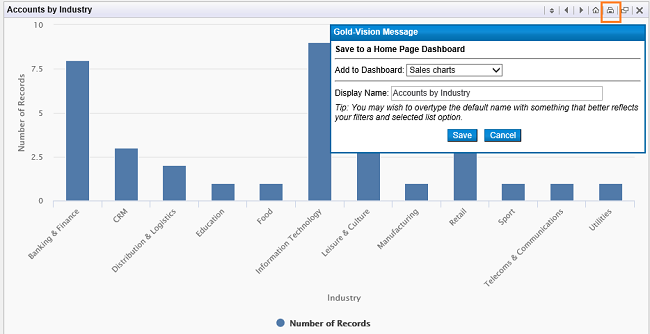
5. Pin the chart to a Dashboard page
The Report Tab in a Gold-Vision lists that allows users to create dynamic, data-visualisation charts that render the data from the current list view. The basic function permits charts to be created or added to the 'Report' view.
These charts will change depending on the data that is currently filtered in the list. The charts can also be used themselves to manipulate the data via a built-in drill-down feature.
When using the Report View remember that almost all of the charts display the data that is currently visible on the list. If the filters are changed, so will the data within charts.
Opening the Report View
The report view can be opened on most main Gold-Vision lists be clicking the
"Report" tab under the "View" section.
Adding Charts/Items to the Report View
Each item area in Gold-Vision has a list pre designed charts which can easily be added to your Report View. To add new items to the report view click the "Add Items to this View" link from
the toolbar on the Report View page.
A list of existing charts and mini widgets will open below the toolbar. Click on any of the items to add them to your Report View.
Items added to the Report View will appear within a control box and will remain on the view until you remove them.
Each users' Report View is their own - i.e. you can add and remove items independently of other users; the view is not shared.
Organising charts
Charts can be controlled in the following ways:
![]()
Toggle height
Reduce Width
Expand Width
Add to Home Page
Print
Pop-out
Remove
Export
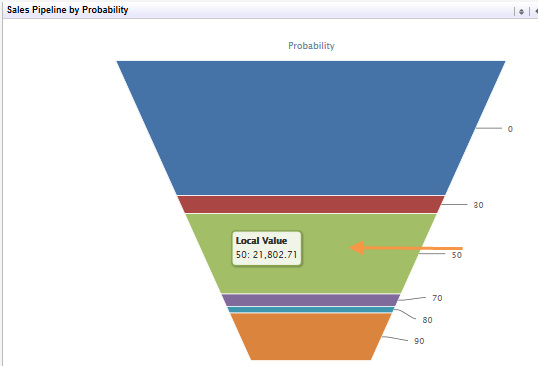
Drill-Down Functionality
Most charts support the ability to drill-down to the data within a particular
point or chart range.
To perform a drill-down, click on the point or chart area that you will like to see the data for.
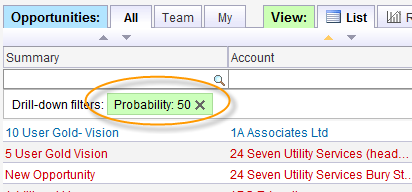
The screen will reload and you will be returned to the list with an addition filter(s) in accordance with the chart area you clicked on.
The "drill down" filters are displayed in boxes in the same colour as normal list filters.
 |
 |
Creating new a Custom Chart
To create a Custom chart open
the Report View and click the "Create a new Chart" link.
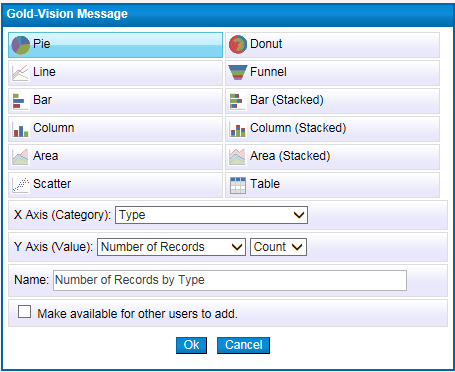
You will be shown a mini designer from which you can select the "chart type" (bar, pie, line etc) plus a choice of fields to select for the X, Y and Series axis.
Please note that the Series option will not be available for charts with a mono-series, like a pie chart.
As well as choosing the columns to display the data for in the chart you can also select how the data is displayed.
Select the options you would like to be displayed on the chart and click "OK" to create it an add it to the Report View.
Text Fields
No option / Default - Will simply group the data you select for the column
(typically used for text-based columns)
Count Number of Records - Will count the number of records of each unique type.
Numeric Fields
Sum - Sum's numeric data
Average - Mean of numeric data
Min/Max - Min or max of numeric data
Date Fields
Group by Month - Groups by Month only (NB: Across ALL YEARS until you filter by
a particular year).
Group by Month and Year - As above but includes year also.
Group by Quarter - Groups by quarter in a similar way to the "Month" grouping
above
Group by Quarter and Year - As above but includes the year
Group by Year - Groups by the year.
Sharing Charts
The option makes the chart visible to all users, allowing them to
add this chart to their Report View, from the 'Add Items to the View' option if they choose.
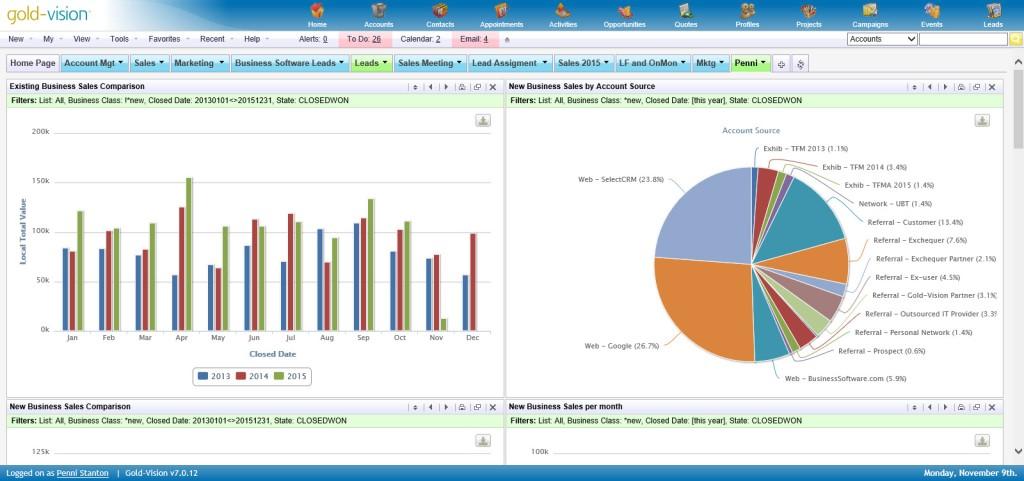
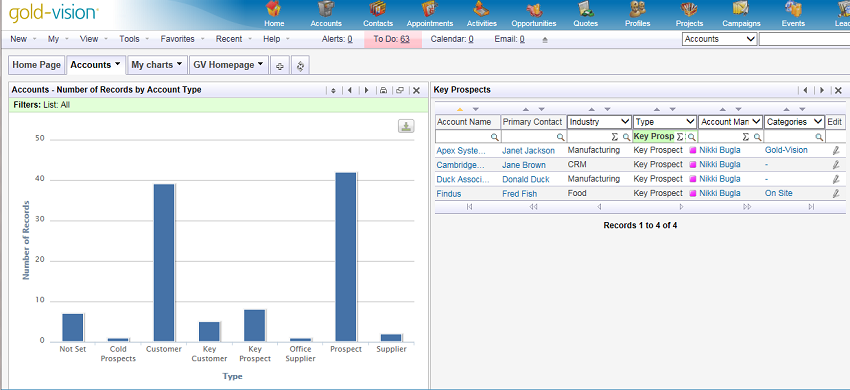
When you have created a chart from a Report View, this can be pinned to a Dashboard. Once a chart has been pinned to a dashboard, its filters and sort order remains fixed and will dynamically display results based on the filters.
Creating and Adding to Home Page Dashboards
Home page dashboards can be created and added to by clicking the small 'house'
icon in the top right hand corner of most chart items.
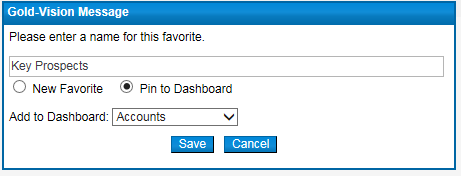
A control will pop up asking the user to enter a name of the pinned chart and whether to add the chart to an existing home page dashboard or create a new one by name.
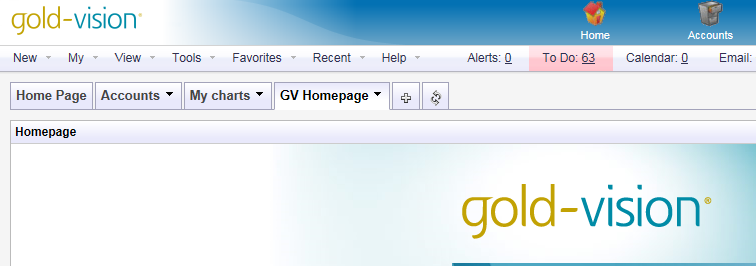
After creation dashboards will appear on the home page as separate 'tabs' and maintain the powerful drill-down functionality.
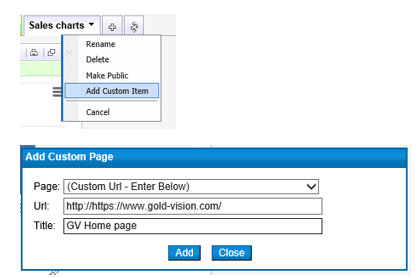
Dashboards can be Renamed, Deleted and shared - Make Public
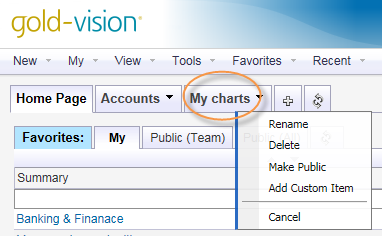
Add Custom Item
Add a url (eg your Intranet, company website) for quick access
There are two new dedicated "Sales" lists added to the 'View' menu.
The purpose of the lists is to allow for listing and reporting on the 'sales' data that is currently held in multiple different areas of the system: Opportunities with and without Quotes, Quotes themselves and confirmed Seminar Bookings.
Sales - Shows a collaborative list of Opportunities, Quotes and Bookings that are
"Closed Won". -
Forecast - As above by only "Open" items. Can be changed to show
Open & Closed Won together.
Product Sales - The existing product sales view.
Note: Only Quotes that are "Included in Opportunity" are shown and Seminar Bookings that are "Confirmed
User sales targets have been added into the system. These allow for a target to be defined by administrators on a per-user basis and are tied to a specific date period and frequency (Month, Quarter, Year).
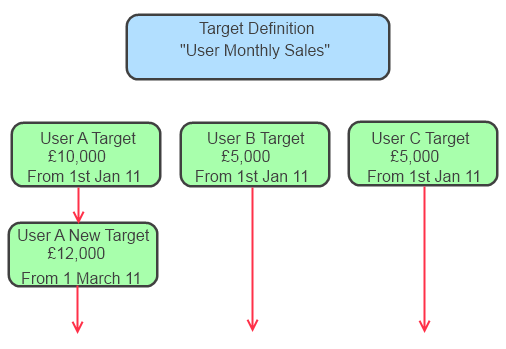
User sales targets are split into two layers within the system:
Target Definition (parent) - This is the 'parent' layer and allows administrators to define a 'Period Type' (monthly, quarterly, annually) as well as specify a name. Multiple definitions can be created to cover different periods or for other arbitrary uses.
User Targets (child) - User targets are 'children' created underneath Target Definitions and are created per-user. Administrators can select the user, currency, target value and 'start date'. The 'start date' represents the date the target will be applied from. To create a "stop" date or to change the user target after a period of time administrators can create a new User Target with a later 'start date'.
In line with the above User Sales Targets, charts can be created that show the
targets with respect to actual sales. These charts are only available under the
'Sales' area of the system. The sales target charts fall under two distinct
visual types...
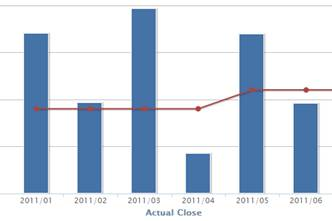
1. Target Charts
Target charts are shown in the form of 'column' charts displaying the 'actual
sales values' with an line overlaid to show the 'target'. The data that is
displayed for the 'target' will depend on the list filters. If there are no
filters on Owner or Team then the chart will display the sum of the targets for
all users. If you filter by a particular user then both the sales data and the
target will change accordingly.
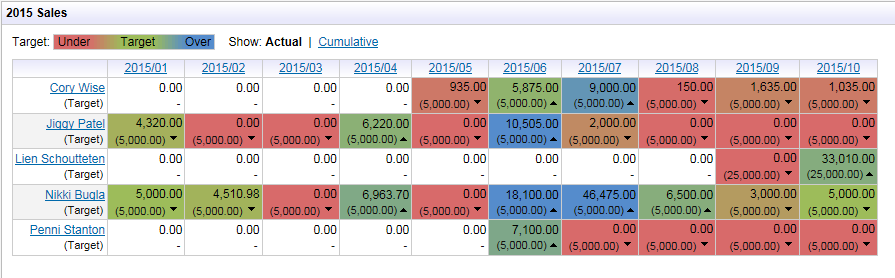
2. Heat Tables
Heat tables show essentially the same data as the Target Charts only in table
format. The background of each cell will change colour according to how close or
over target the 'actual' sales value is. The background will tend to red if the
value is under target, green as it approaches target and blue when it is over
target.
The table can be viewed in "Actual" mode (showing the actual values per period) or in "Cumulative" mode that will sum both the actual and target values along each row.
Creating New Target Charts
Users with rights to do so can create new Sales Target
Charts . This can be done using a similar designer to the custom chart designer
described above. To create a new Target Sales Chart:
1) Open the "Sales" list and go to the "Report View"
2) Click the "Create a new Target Chart" link. A popup will appear (see below)
3) Enter a Name
4) Select either "Target Chart" or "Heat Table"
5) Select the "Period" you would like to report on (month, quarter, year)
6) Select the Target Definition(s) to display on the chart and click 'OK'
There are 'access options' for the following areas:
Sales (access only) - When off users in the team cannot see
sales lists.
Dashboarding (read, edit, delete) - When off users cannot see
"Report View" and "Dashboards". When 'edit' off users can only user existing
charts.
Targets (read, edit, delete) - When off users cannot see
targets on charts. Edit/delete rights control Admin Console management of
Targets.
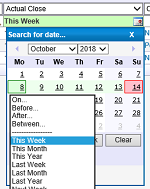
Create time based charts eg “Today”, “This Week” “Last week” and your dashboards will be dynamically updated to show the most up to date information
To create a chart you can use year after year - for example Sales Year to Date, when selecting a date field, select 'this year'
Don't forget to change the name of the chart before you save it, charts are currently un-editable
Use the Zoom function to change the size of your chart
Drag and drop charts into new positions on your page
Don't forget you can create dashboards with charts and lists from any item area in Gold-Vision
Add a custom page, for example an Intranet to your Homepage Dashboard
Lists can also be pinned to a Homepage Dashboard
Charts can be used to set Targets and show performance against them